Malaysia Population Research Hub

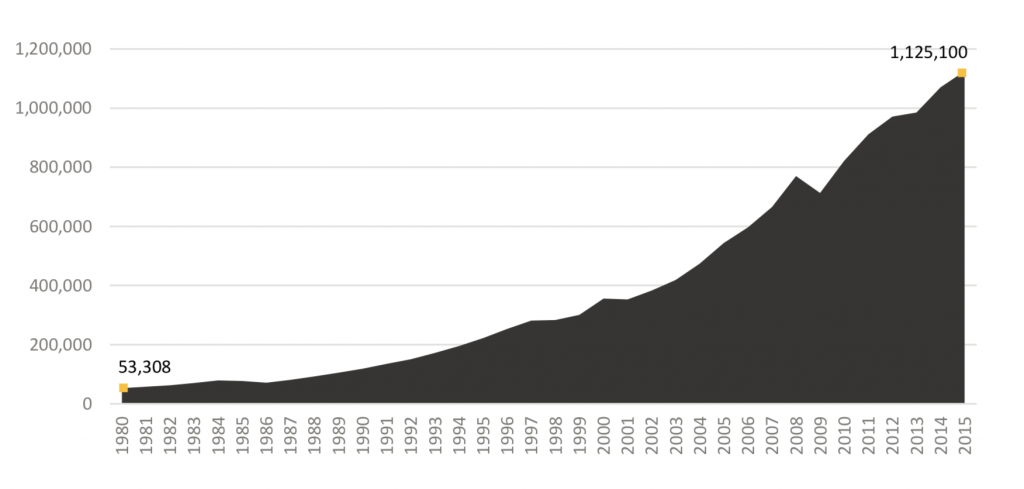
GDP at current prices (RM million), Malaysia, 1980-2015
Source: Department of Statistics Malaysia
As Malaysia progressed rapidly over the past several decades, so has the size of its economy. Malaysia GDP has grown steadily from about RM53.0 billion in 1980 to RM1.13 trillion in 2015. With a population size of 31.9 million in 2016, Malaysia domestic economy is still considered small from a global standpoint and similarly, compared to many of its ASEAN neighbours, thus strictly from an academic viewpoint it should be quite vulnerable to global economic crises. However, despite this being the case, Malaysia has been relatively resilient in the face of global crises, such as the 1997-98 financial crisis and the 2008-09 subprime mortgage crisis. While most of this can be attested to good governance, part of this is also attributed to Malaysia continual investment into building the synergy between the country population and the economy, in terms of upskilling its workforce and ensuring economic opportunity for all over the past decades.
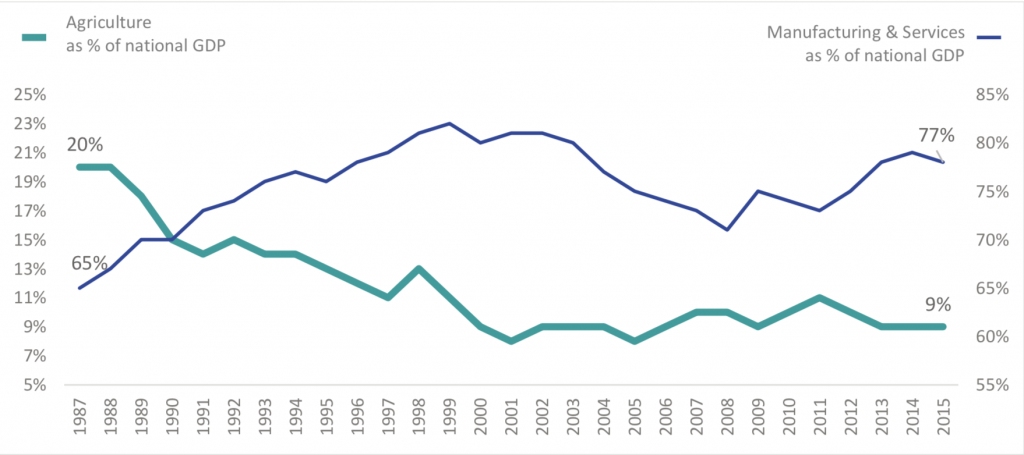
Contribution of selected economic sectors to national GDP at current prices, Malaysia, 1987 to 2015
Source: Department of Statistics Malaysia
The synergy between the country economy and the population has always been a focal point of development, and is evident from the eleven Malaysia Plans that have guided the country thus far. The early Malaysia Plans focused, by-and-large, on reducing poverty among families, improving socioeconomic conditions for all races specifically, the elimination of race identification with specific economic activities and expansion of labour-intensive sectors in order to drive economic development and growth. This is followed by a period of consolidation, from 1986-2000, focusing on balanced and moderate growth across all economic sectors. From the turn of the century onwards, the roadmap for the nation once again shifted its focus back to the population, particularly through a vision of unity and harmony among the population is transformation of key economic areas in the 10th Malaysia Plan.
The 11th Malaysia Plan, detailing the last mile from 2016-2020, is perhaps the most people-oriented driven roadmap that has been developed until now, emphasising that sustainable development can only be achieved by raising the skills and productivity of the people, and ensuring that this development occurs equitably such that it covers the entire spectrum of society.
The 11th Malaysia Plan focus on raising productivity and skills of the population comes at a right time, seeing as the country first demographic dividend is coming to an end. The first demographic dividend is defined as a period where the labour force temporarily grows more rapidly than the population that depends on it, caused by the economic transition from a predominantly agriculture society with high fertility and mortality rates to a predominantly urban industrial society with low fertility and mortality rates. Resources are thus up(or considered from another perspective, excess resources are being generated), and can be used to for economic investments, developments, and society welfare. Typically, the period from which the first dividend is reaped can be up to five decades or more.
Since the 80, Malaysia agriculture contribution to the national GDP has decreased from 20% in 1987 to just 9% in 2015 (i.e. a decrease of 11 percentage points), compared to its manufacturing and services contribution to the national GDP, which has increased from 65% to 77% within the same time period (i.e. an increase of 12 percentage points).
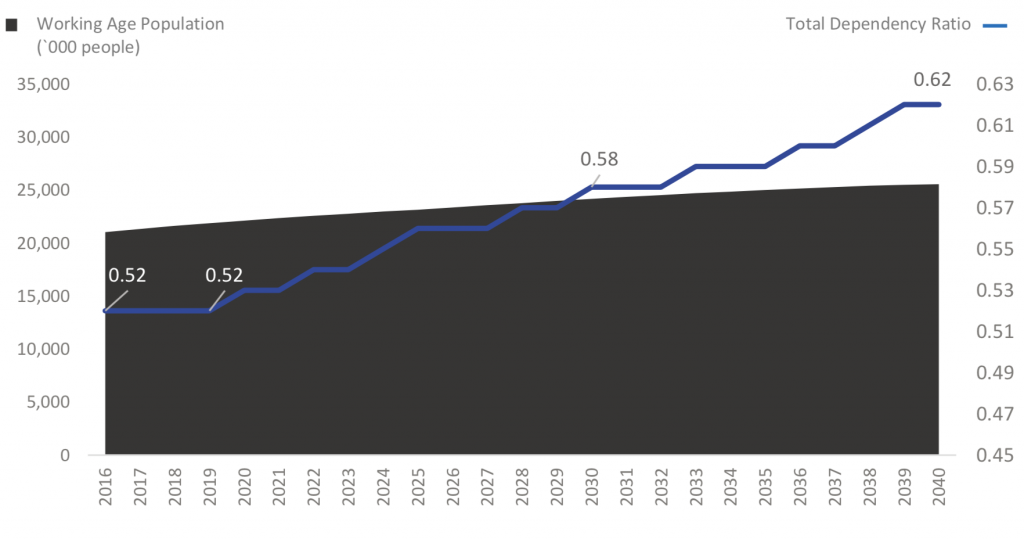
Total dependency ratio, Malaysia, 2016-2040
Source: Department of Statistics Malaysia; Ipsos Analysis
Note: Working age population taken from 15-59.
Malaysia first demographic dividend occurred well before this time, and the first dividend is still reaped today. This is evident from the total dependency ratio, which has continued to decline from 0.75 in 1982 to 0.47 in 2015. The first demographic dividend coupled with progressive economic policies have contributed to Malaysia economic development.
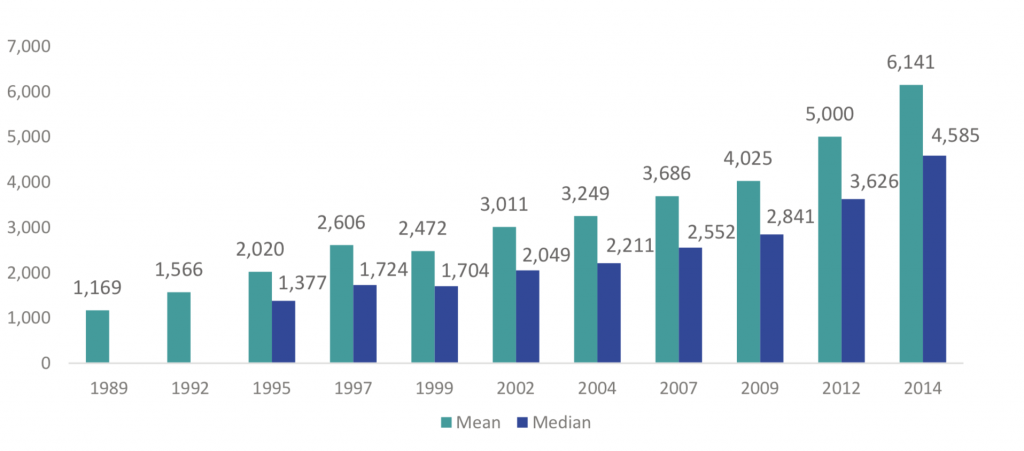
Mean and median monthly household income (RM), Malaysia, 1989 to 2014
Source: Household Income and Basic Amenities Report 2014, Department of Statistics Malaysia
As a result, the economic wellbeing of families has improved: mean monthly household income has increased 425% from RM1,169 to RM6,141 from 1989 to 2014, and median household income has increased 330% from RM1,377 to RM4,585 from 1995 to 2014; poverty has subsequently decreased from 16.5% in 1989 to 0.5% in 2014, and hardcore poverty has been reduced from 3.9% in 1989 to 0.2% in 2012.
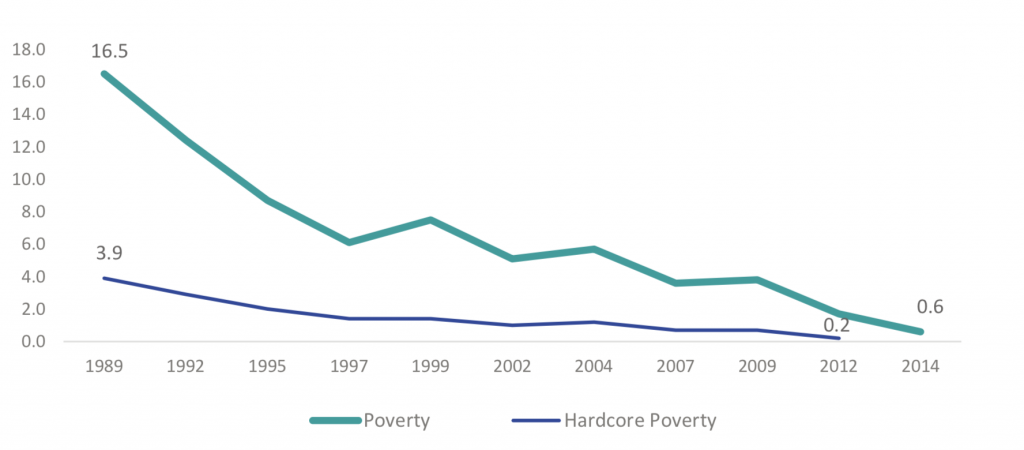
Incidents of poverty and hardcore poverty (%), Malaysia, 1989 to 2014
Source: Household Income and Basic Amenities Report 2014, Department of Statistics Malaysia
Comparing the age pyramids of Malaysia between 2010 to 2040 provides the first visual signal of the end of the first demographic dividend. From 2010 to 2015, the pyramid is still characterised by an enlarging base, where the number of population aged 64 and below still outnumber those who are above 64.
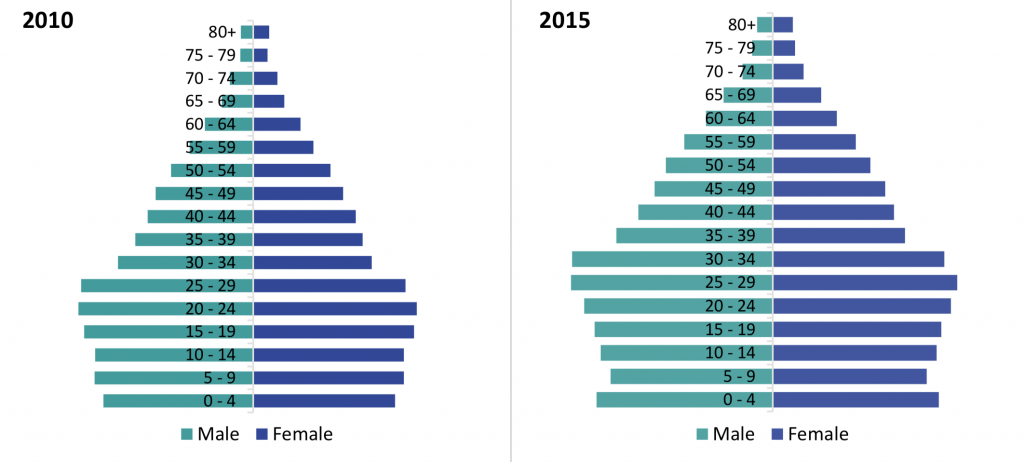
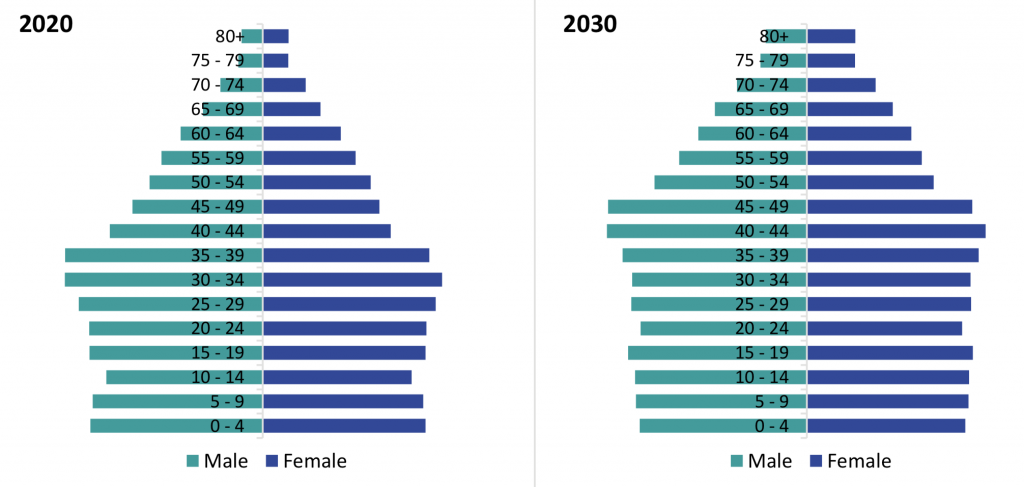
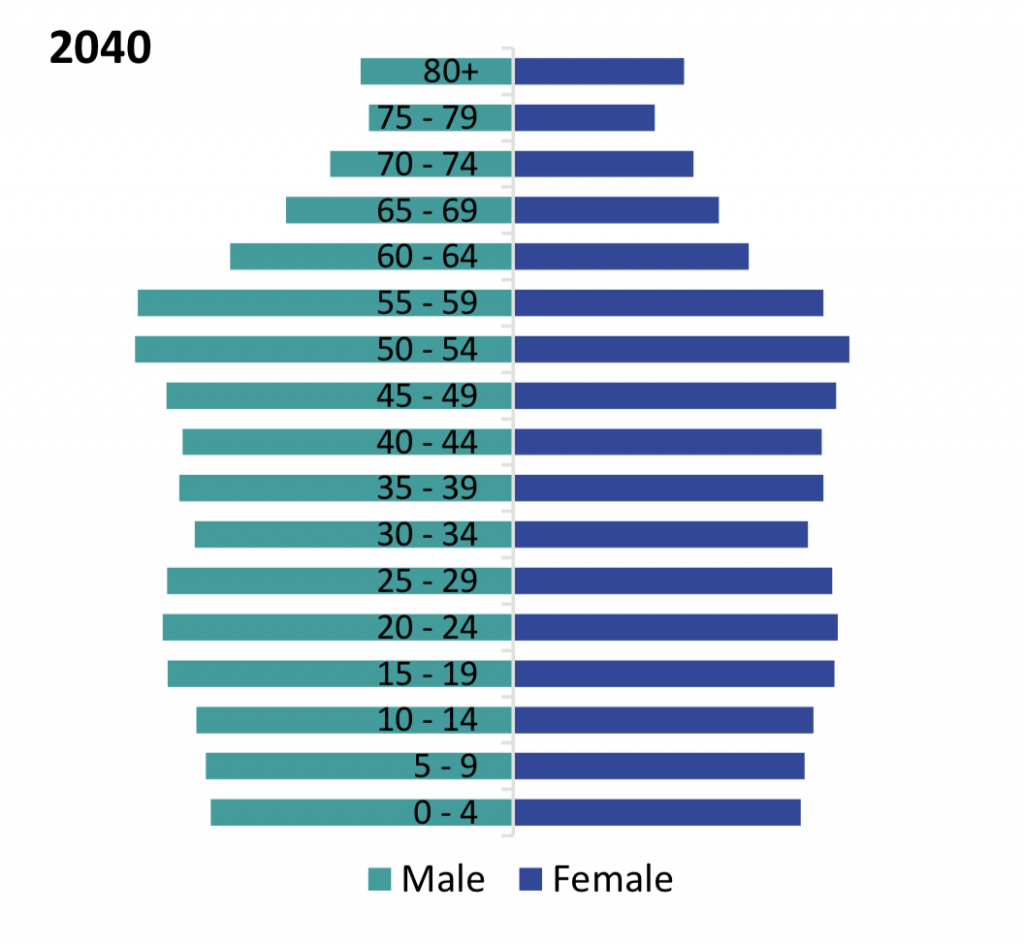
Population distribution by age Group and gender, Malaysia, 2015 and 2040
Source: Department of Statistics Malaysia; Ipsos Analysis
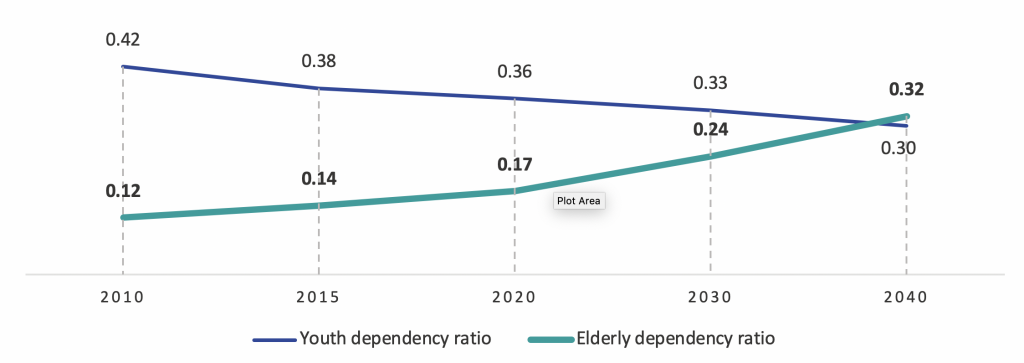
Youth and elderly dependency ratio, Malaysia, 2010 to 2040
Source: Department of Statistics Malaysia; Ipsos Analysis
Note: Working age population taken from 15-59
However, from 2015 to 2030, the age pyramid is projected to gradually shift upwards plus a gradual reduction in the width of the base, indicating that the proportion of dependents is gradually increasing.
This is caused by the fact that the continual decline in the TFR has finally caught up and its effects are beginning to show. The increase in dependents continues up to 2040, where a wide, flat top sits at the top of the pyramid and the pyramid moves closer to cylindrical in shape.
The trend of increasing dependency is even more prominent if the working age population assumes the Asian convention of 15-59. In this scenario, Malaysia dependency ratio is projected to hover around 0.52 between 2016 and 2019, before rising steadily to 0.58 in 2030 and to 0.62 in 2040.
The implications of this is that while the working age population still outnumber the population dependent on it, the rate of growth in the number of dependents has already exceeded the rate of growth of the working age population, signalling the tail end of the first demographic dividend.
In addition, the upshifting of the age pyramids also imply that the larger group of dependents would be the elderly as opposed to youths. Indeed, projections indicate that the elderly dependency ratio is expected to rise steadily from 0.14 in 2015 to 0.24 in 2030, then 0.32 in 2040; whereas the youth dependency ratio is expected to decrease from 0.38 in 2015 to 0.33 in 2030, dropping further below the elderly dependency rate to 0.30 in 2040.